What Cloudways MCP 2.0 actually adds
There is a specific kind of 1am that anyone who hosts sites for other people will recognise. A client’s checkout page is throwing 502s, my phone is buzzing, and before I can say anything useful I need to open a terminal, SSH into the right server, and tail two files: the Nginx error log and wp-content/debug.log. The diagnosing part is usually quick. Getting to the point where I can start diagnosing is what eats the half hour.
Cloudways MCP 2.0 goes after that half hour. The MCP server Cloudways runs already let an AI client trigger server and application level actions, things like clearing caches or reading basic app state. What version 2.0 adds is log access. An agent connected to that server can now pull application and server log files as tool output, so the agent reads them directly instead of me copying them down, saving them to disk, and pasting chunks into a chat window. The announcement is up on the Cloudways blog (opens in new tab) if you want the vendor’s own framing.
What has not changed is the boundary around anything destructive. Restarts, scaling, deleting, changing PHP versions, all of that still lives behind the Cloudways console and your login. Reading a file and restarting a service are very different levels of trust, and the release keeps them separated. That separation is the most important detail in the whole announcement, because an agent that can read your error log is genuinely useful, while an agent that can also bounce PHP-FPM on production without you watching is a different conversation entirely.
I want to be clear about what this post is. It is not a pitch for AI in hosting, and I am not going to pretend a model reading a stack trace replaces knowing your stack. It is about what an agent can actually read, what it can realistically do with that, and where the whole thing falls over. The source material is thin on implementation detail, so anything below the feature headline comes from how MCP servers generally behave plus what I can see on my own Cloudways boxes. I will flag the gaps as I go rather than fill them in with guesses.
Background: what an MCP server sits between
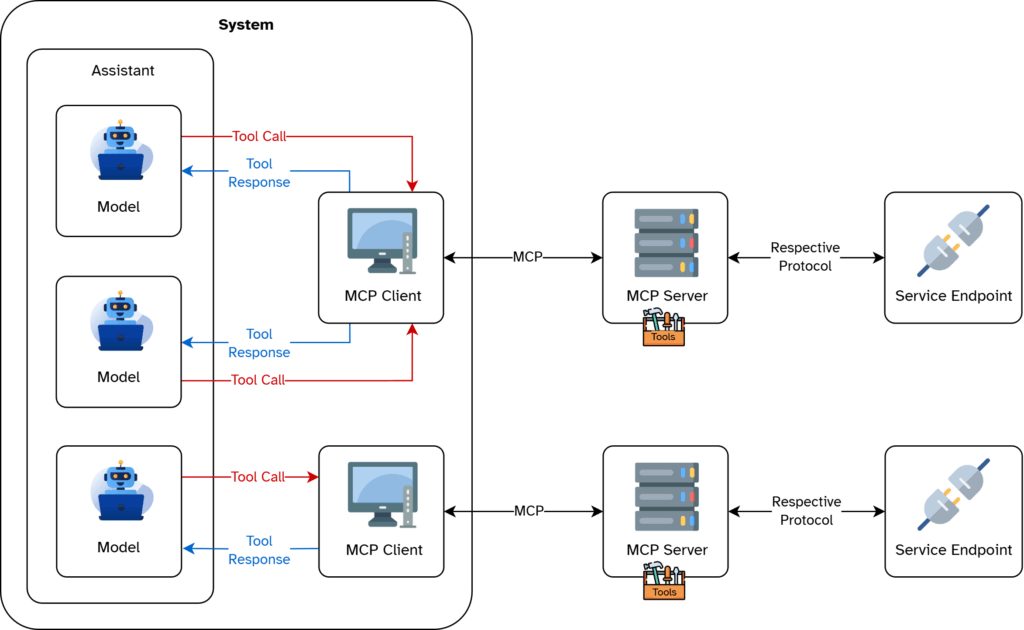
The Model Context Protocol, at the level that matters for this conversation, is a contract between an AI client and a set of tools. The client asks the server what it can do, the server returns a list of tool names with input schemas, and the model then calls those tools by name with arguments. The server does the work and hands back text. That is the whole loop.
The reason a hosting company ships one of these instead of a plain REST API comes down to who writes the glue. An API still leaves me handling auth, writing a wrapper, and deciding which endpoints the model is allowed to call. An MCP server arrives with the tool definitions already written, so I add a URL and a token to a config file and the agent can call something like list_applications or get_server_status without me writing a line of code in between. For a vendor, that also means the boundary of what an agent is permitted to touch is defined once, by them, rather than by each customer’s wrapper script.
Before 2.0, the Cloudways MCP server was operational in scope. Server and application level actions, status checks, that kind of thing. What it did not expose was log content. You could ask the server about the state of an application, but not about what the application was saying while it was falling over. To use a comparison a site owner will recognise, it was like having a dashboard showing you the engine warning light without any way to read the fault code behind it. Log access in 2.0 is that fault code.
I should be honest about where my knowledge ends. The announcement itself does not spell out the implementation. It does not tell me the log rotation policy on the MCP side, or how a token is scoped to a specific application versus a whole server, or whether the tool output is truncated for long files. What I can say is how MCP servers generally behave when they expose file reads, and I have confirmed the paths on my own Cloudways instances. Where the source is silent, I am reasoning from the protocol, not reporting a fact, and I will keep that distinction visible for the rest of this post.
What’s happening now with Cloudways MCP 2.0 log access
In one line: an agent connected to the Cloudways MCP server can pull application and server log files back as tool output, rather than you going and fetching them yourself. The Cloudways announcement (opens in new tab) bundles that with WordPress fleet management under the 2.0 label. For anyone who has spent time dragging a log file down over SFTP at an unhelpful hour, the appeal is obvious.
Which logs actually matter on a Cloudways box depends on what broke. The application logs sit under /home/master/applications/<app>/logs/, and that is where the Nginx and Apache error logs live. PHP-FPM output is in the same neighbourhood. If you have WP_DEBUG_LOG enabled, wp-content/debug.log is the file that catches a plugin fatal error with the stack trace still attached. System level messages are in /var/log/, which is the layer below the application and usually where you end up when the app logs are empty but the site is still returning 502s.
The distinction I keep coming back to is read access versus write access. An agent that can read a PHP-FPM log and tell you a worker pool was exhausted is doing diagnostics. An agent that can also restart PHP-FPM is doing remediation. Those carry very different risk profiles, and the first one is a much safer thing to hand to a model. Reading is reversible. Restarting a pool on a production server during a traffic peak is not.
There is also a reasonable amount the source does not answer. Retention is the first one. If Cloudways keeps rotated log files for a short window, an agent asked to summarise last week’s errors may just find nothing and report that the site was healthy, which is the worst possible failure mode for a diagnostic tool. Second is scoping. Whether a token grants access to one application’s logs or every application on the server changes how you would deploy this for a client fleet. Third is credential storage, and I have not seen a description of how the MCP token is stored or rotated on the Cloudways side. I am not treating any of those as settled until I see them documented or test them myself.
Fleet work is where this pays off first. On a single site, reading the debug log through an agent saves you one SSH session and maybe two minutes. Across twenty client sites, it changes the order you work in. One session that walks the PHP error log on every application and comes back with a shortlist of which three actually threw something this week is worth more than the time saved on any one of them. The other seventeen sites needed no attention, and you did not have to open seventeen terminals to establish that.
A worked example helps here. Say a WooCommerce store where checkout silently dies on one payment gateway. The customer writes in and says the order fails after they click pay. You ask for an order number and a rough time, then SSH in, grep debug.log around that timestamp, and find a fatal in the gateway plugin’s callback. With log access, the agent can read that file and hand you the stack trace with the plugin name and line number on the first pass. The exchange collapses into a single message. Fewer round trips with the customer, and the diagnosis has already started before you have opened a terminal.
The honest limit is that log lines only mean something to an agent that knows your stack. A generic model handed a WooCommerce fatal error will often locate the file and line correctly and then guess wrong about who owns it, or blame WooCommerce core when the real culprit is a shipping extension. I have watched models confidently misread a trace where the fatal came from a require_once on a file a plugin had deleted during an update. Treat the first pass as a pointer toward the problem, not a verdict on it. You still confirm before anything changes.
Cost and privacy deserve a line because debug logs are messy by nature. WP_DEBUG_LOG output regularly contains customer email addresses, IP addresses, and in badly written plugins the occasional API key or database credential sitting inside a failed request dump. Every line the agent reads is a line leaving your server and going to whichever model provider sits behind the client, and that is worth thinking through before you point this at production rather than staging.
Questions people are asking about AI agent log access
Can an AI agent read Cloudways logs without SSH?
Yes, once the MCP server is connected to your client. The agent calls a tool, the tool returns the file contents, and the lines land in the conversation. What that removes is the tedious part: managing keys for whoever is on call, copying a log down to a laptop, trimming it before pasting it into a chat window. If you have ever dropped 400 lines of debug.log into a chat and then apologised for the volume, this is the same workflow with the copy step deleted. It does not remove the need for an SSH session when you want to edit a config file or watch a process live.
Does the agent get write access to the server?
Not through log reads. Reading /home/master/applications/<app>/logs/ and restarting PHP-FPM are different permissions, and only the second one can take a site down while you are asleep. My own position is that log reads should be open and remediation actions should not, at least not without a human one step behind. An agent that can see a 502 and tell you the upstream timed out is useful. An agent that can also bounce the pool on its own judgement sits in a different risk category, and I would want a change log on my side before handing that over.
Which logs should I point it at first?
PHP-FPM and the Nginx error log. Those two cover most of what actually pages you, from PHP crashes to upstream timeouts when the pool is saturated. The WordPress debug.log comes third, and it only exists if someone switched WP_DEBUG_LOG on. On plenty of client sites it has been appending quietly for months and nobody has read a line of it, which is exactly the kind of file an agent is good at skimming.
Is this a replacement for a proper log tool?
No. An agent reads what you ask it to read, in the session you opened. A log aggregator keeps months of history, alerts you at 3am, and lets you search every server in one query. The MCP server is a shortcut for diagnosing the box you are already staring at, not a retention or alerting layer. Keep both, and treat the agent as the thing that tells you which server deserves the aggregator query.
What to expect next
Log access is normally the thin end. Once an agent can read the error log, the obvious next ask is for it to do something about what it finds, and the shape that usually takes is scoped remediation: restart this pool, purge that cache, roll back this plugin version on this one application. Cloudways already ships SafeUpdates and the Cron Optimizer doing narrow automated work inside boundaries, so a bounded action is not a new idea on the platform. What would be new is an action triggered by a model’s reading of a log line rather than by a schedule. I would expect the first version of that to arrive as a suggestion with an approve button, and I would not be surprised if it stayed that way for a while.
The two things worth watching on the Cloudways side are the changelog and the AI Copilot preview, which are almost certainly the same project seen from two angles. The announcement post for MCP 2.0 (opens in new tab) describes Copilot as handling troubleshooting insights and one-click resolutions. If Copilot is the interface where a human confirms a fix, the MCP server is roughly that same capability opened to whichever client you already use, Cursor, Claude Desktop, or a script you wrote yourself. When the two converge, the question that matters is whether the MCP tools inherit Copilot’s permission model, or whether log reads and server actions get separate scopes you can grant independently. That is the line I would read the changelog for.
On timelines I genuinely do not know, and anyone giving you a quarter is guessing. Hosting vendors announce MCP support far more often than they ship a stable version of it, and Cloudways has a habit of keeping features in beta for a long stretch, which is a defensible choice when the alternative is an agent restarting services on paying customers’ boxes. My expectation is that read coverage across all applications and servers lands first, because it cannot break anything, and that any write action shows up behind Copilot with an approval step rather than as a raw tool. Treat that as a guess, not a roadmap. If you are thinking about building internal tooling against these endpoints now, keep the integration thin and assume the tool names and response shapes will change at least once before this settles.
Your next step
Wire the MCP server into one Cloudways staging app this week. Not production, not the client site that pays your mortgage. Staging exists for exactly this kind of testing, and if the agent does something stupid with a tool call, the blast radius is a box nobody depends on.
The setup itself is the boring part: add the MCP server to whichever client you use, point it at the staging app’s credentials, and confirm it can list your applications at all. That last check matters more than it sounds. If the agent cannot enumerate apps, it will not be able to resolve the log paths underneath them either.
Then give it one specific job. Something like: read the last 200 lines of the PHP error log for this application and tell me what is failing. On Cloudways those logs live under /home/master/applications/<yourapp>/logs/, with the PHP-FPM and Nginx error logs sitting alongside each other. You already know what is in those files if you have been debugging the site, so you have a ground truth to check the answer against. That is the whole point of starting on staging: you can catch a wrong answer before it costs anyone anything.
Read the response carefully. I would be looking for two failure modes in particular. The first is invented paths, where the agent names a file like /var/log/nginx/error.log that does not exist on a Cloudways box because it is pattern-matching from generic Linux documentation instead of reading what your server actually has. The second is a confident misreading of a stack trace, where it blames your theme when the fatal is coming from a plugin that hooks into it. Both are easy to spot when you already know the answer and nearly impossible to spot when you do not.
If the output holds up, expand to one production application. Keep a human reading the proposed fix before anything gets applied, and keep the agent’s role at reading and explaining for now. Log access on its own is genuinely useful even if you never grant a single write action, because the expensive part of an incident was never the fix, it was the twenty minutes you spent finding out which file to open.
Give it a fortnight on that one production app before you decide whether to roll it across the rest of the fleet.